How to Compare Two Images
Comparing two images in a way that is efficient and robust can be surprisingly challenging. At the IDeA Lab we tackle this task everyday, read on to learn some quick tips and techniques.
Outline
- Background behind the task at hand.
- An introduction to Confusion Matrix’s.
- Confusion Matrix’s in action.
- Conclusion.
Why Compare Two Images?

At the IDeA Lab we utilize a convolutional neural network to create whole head segmentations of MRI images. These segmentations are then processed and analyzed to gather data that is sent to research labs across the United States. The quality of these segmentations must be constantly monitored because they are the base that all of our analysis builds on. The most robust and efficient way to calculate segmentation performance is by using a Confusion Matrix.
Confusion Matrix
A confusion matrix is used to easily read the amount of True Positive (TP), True Negative (TN), False Positive (FP) and False Negative (FN) predictions between a ground truth and prediction.
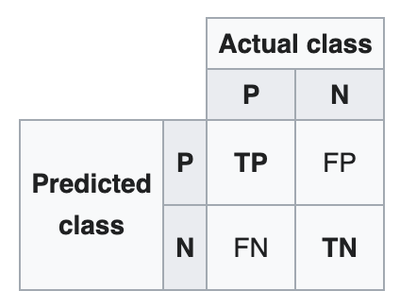
When comparing a ground truth segmentation and a prediction segmentation:
- True Positive: The amount of voxels that are CORRECTLY predicted as brain in the prediction when compared to the ground truth
- False Positive: The amount of voxels that are INCORRECTLY predicted as brain in the prediction when compared to the ground truth
- True Negative: The amount of voxels that are CORRECTLY predicted as NOT brain in the prediction when compared to the ground truth
- False Negative: The amount of voxels that are INCORRECTLY predicted as NOT brain in the prediction when compared to the ground truth
Once the matrix is created these values are used in many formulas to judge overall segmentation performance.
Do not rely on one metric, calculate many metrics and judge performance on all of the scores.
Confusion Matrix’s in Action
We are going to assume that you have your two images ready to be compared. Constructing a confusion matrix can take a while to run but is fairly easy to do in python.
First we are going to be using the package sklearn and numpy.
import sklearn
import numpy as np
Before we construct the confusion matrix your images need to be thresholded and raveled.
# pick a threshold that works best for your data, we typically use 0.34
thresh = 0.34

# threshold your data
# taking the product of the img > thresh and 1 binarizes the result
img_1_thresh = (img_1 > thresh) * 1
img_2_thresh = (img_2 > thresh) * 1

# now ravelize your Images
img_1_ravel = img_1_thresh.ravel()
img_2_ravel = img_2_thresh.ravel()
Now that your images are ready, construct the confusion matrix using sklearn. Note this can take some time to run.
c_mat = sklearn.metrics.confusion_matrix(img_1_ravel, img_2_ravel)
Once this has completed simply define your variables and you are ready to calculate your segmentation performance!
tn, fp, fn, tp = c_mat.ravel()
Once your variables are defined use the table below to find which formula to use for your own case.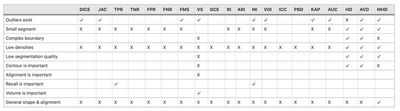
Conclusion
It is important to use multiple metrics when judging performance, each metric has its own strengths and weaknesses. If you are still interested in Confusion Matrix’s I highly suggest the paper Metrics for evaluating 3D medical image segmentation: analysis, selection, and tool. This paper goes much more in depth and should answer any questions you may have.
Sean McDougall
Staff Research Associate I
My research interest is cognitive neuroscience and illusory perception.